Economics of testing
Testing as a risk-mitigation investment
Testing is an appraisal activity: it produces evidence about risks by exposing defects and failure modes. Testing does not reduce risk on its own. Risk is reduced only when the findings lead to effective action: fixes, mitigations, controls, rollback plans, guardrails, and so on.
Like any other engineering activity, testing consumes resources: time, effort, and tools.
In economics, investment is commonly defined as “any asset obtained at a cost, on the expectation that it will deliver future value greater than its initial cost”.
Testing fits this definition: it is an investment made today to reduce the probability and impact of costly failures tomorrow, thereby optimizing future outcomes.
Because testing is an economic investment, its return cannot be guaranteed. At best, we can estimate expected value: testing reduces the likelihood and impact of costly failures, but those failures may never occur. In that sense, testing is comparable to insurance or preventive healthcare: we spend resources today based on forecasts of risk and cost, to reduce exposure to larger, uncertain losses later.
The Cost of Quality (CoQ) framework
The economics of testing can be described using the classic CoQ framework, which categorizes quality-related costs into four types:
- Prevention costs: activities that prevent defects from being introduced
- Training, standards, process improvements
- Design reviews, architecture reviews
- Threat modeling, security design
- Coding standards, best practices
- Appraisal costs: Activities that detect defects before they reach customers
- Testing (static and dynamic)
- Code reviews, inspections
- Static analysis (SAST, linters)
- Quality audits, reviews
- Internal failure costs: Costs of defects found before release
- Rework, bug fixing
- Debugging time
- Re-testing after fixes
- Delayed releases
- External failure costs: Costs of defects found after release
- Production incidents, outages
- Customer support, escalations
- Lost revenue, customer churn
- Regulatory fines, legal liability
- Reputational damage
The economic goal is to optimize total cost of quality by investing in prevention and appraisal to reduce expensive internal and external failures. Testing, as an appraisal activity, is most cost-effective when the evidence it produces leads to actions that avoid external failures. External failures are often far more costly than pre-release discovery because they combine remediation cost with customer impact, operational disruption, and reputational damage. The size of this multiplier varies widely by domain and defect class, so teams should calibrate it using their own incident data. This framework makes the economic value of testing explicit and legible.
Recognizing that we do need to invest, the next question becomes where to allocate those resources. Budgets are never limitless, and the law of diminishing returns means that simply adding more testing yields progressively smaller risk reduction. Instead, we must treat testing like an investment portfolio: selecting a mix of activities that provides the maximum reduction in risk for the resources available.
To build such a portfolio, we must first identify which risks matter most. The ISO/IEC/IEEE 29119 series (especially the test planning process in ISO/IEC/IEEE 29119-2) supports a risk-based approach where risks and priorities are used to guide what gets tested, when, and how deeply. ISO/IEC 25010 (SQuaRE product quality model) provides a structured set of quality characteristics that can be used as a vocabulary to categorize product-quality risks. Starting from prioritised risks lets us make deliberate, economically sound decisions about what testing to invest in, and how much, so the portfolio matches the organization’s risk tolerance and business priorities. In this document, those quality characteristics are used as risk categories to make risk-based decisions explicit, traceable, and reviewable over time.
These risks are best framed as the risk of failing to meet one or more quality characteristics (see Figure 1). ISO/IEC 25010 defines a product quality model and a separate quality-in-use model in the SQuaRE family. Note that ISO/IEC 25010 exists in multiple editions: the 2011 edition presents eight product quality characteristics, while newer editions update the model. If your organization standardizes on a specific edition, align the labels in this document (and Figure 1) to that edition.
Figure 1: Quality Characteristics
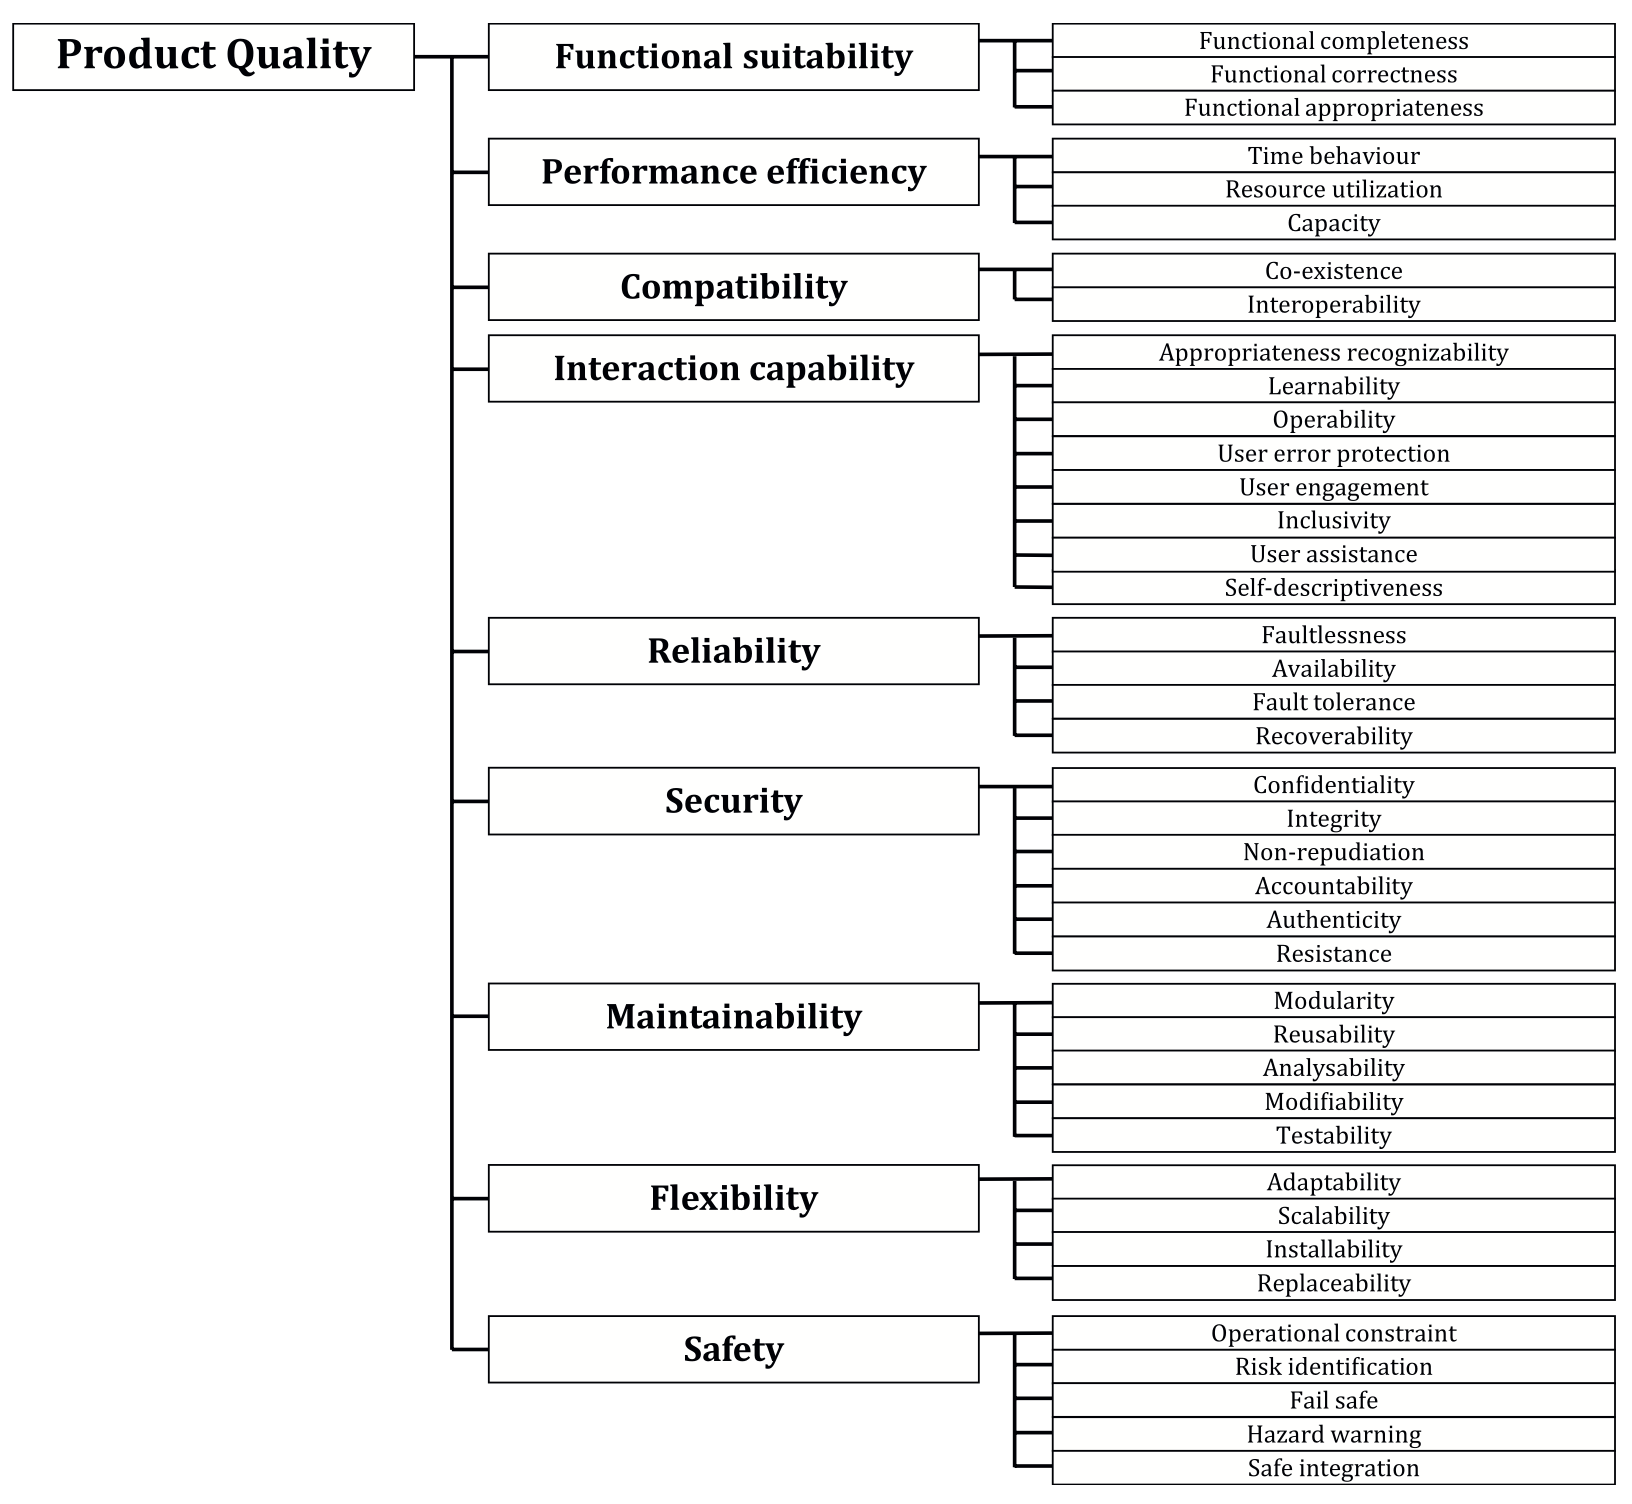
Once risks (i.e., specific quality characteristics at risk) are prioritised, we gain clarity on where to invest: which risks we must reduce most, and which can be given less attention. For example, in an early prototype, maintainability and portability may be low-risk, while in a production system they often become critical.
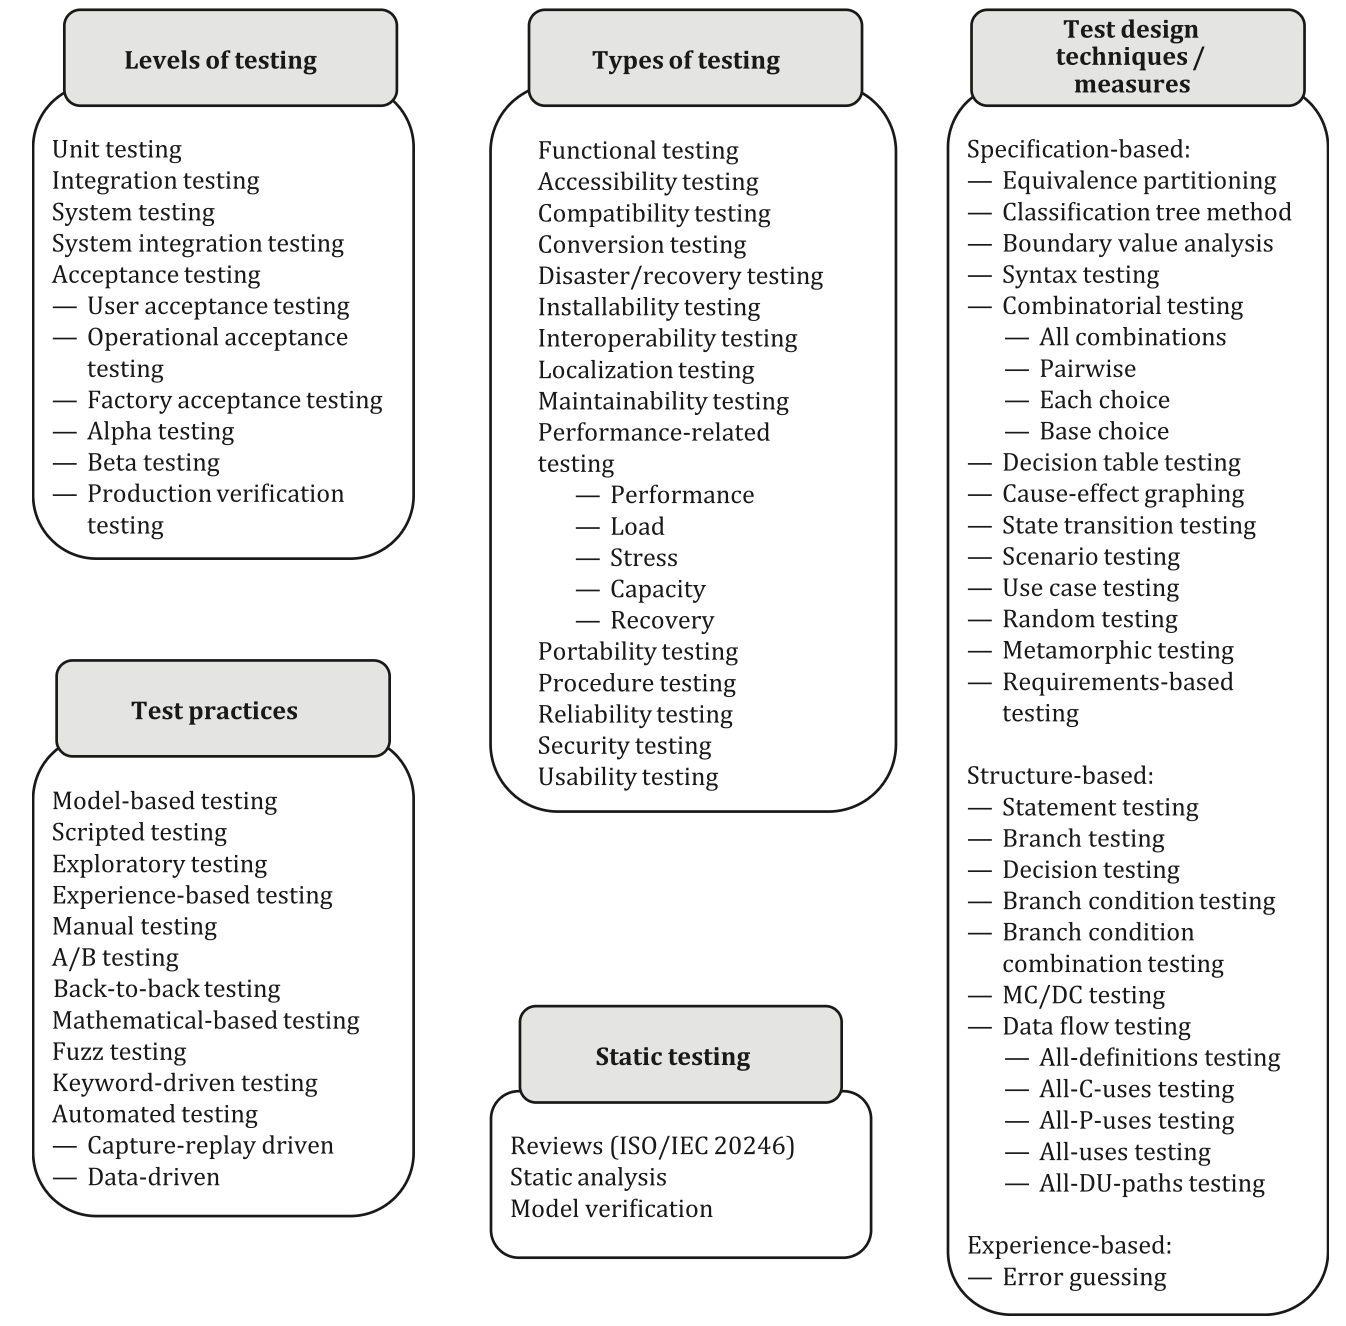
The question of how to invest is more complex. Every testing level, type, and measure (see Figure 2) affects multiple risks at once, and in different ways. Overlap is inevitable: one activity can mitigate several risks, and multiple activities can address the same risk. That overlap is a feature, not a flaw: it creates safety margins. What you must avoid is coverage gaps (“underlap”), where some prioritised risks remain uncovered. Since no investment can eliminate risk entirely, high-criticality risks often justify deliberate redundancy, but only when the checks are diverse and low-correlation (for example, static analysis plus dynamic testing, unit tests plus contract tests, or different oracles). Avoid repeating the same oracle at multiple expensive levels: highly correlated redundancy adds little safety for its cost.
Figure 2: Testing types, activities and measures:
Note: Some industries are governed by mandatory software safety/quality standards that prescribe required verification/validation activities and evidence. Examples include DO-178C (aviation), ISO 26262 (automotive), and IEC 62304 (medical device software).
Key terminology:
- Defect: An error, fault, or flaw in a work product (code, design, requirements, or documentation) that may cause a failure. Defects can exist in the system but may not yet be observed.
- Failure: The manifestation of a defect when the system does not behave as expected. Failures are observed in operation
- Risk: The possibility that a defect will cause a failure, resulting in negative consequences. Risks describe potential future events, not current states.
- Control: A measure that prevents, detects, or mitigates a risk (e.g., input validation, access control, rate limiting, canary rollout, rollback automation, feature flags).
- Appraisal (CoQ): Activities whose primary purpose is to assess or evaluate quality by producing evidence (e.g., testing, reviews, audits). In CoQ language, testing is an appraisal cost.
- Testing activity (ISO/IEC/IEEE 29119): Activities within the ISO 29119 test process that produce test results and work products (plans, conditions, cases, procedures, logs, reports). In this framework, testing activities are a major evidence-producing stream used to support risk decisions.
- Evidence: Information produced by testing or other appraisal activities that supports claims about quality or risk reduction.
- Test basis: The body of knowledge used as the foundation for test analysis and design (ISO/IEC/IEEE 29119). In this framework, risk statements become part of the test basis.
- Traceability: The ability to link testing activities back to specific risks, requirements, or quality characteristics, enabling justification and measurement.
The prioritised list of testing approaches defines the test strategy for the identified and prioritised risks. In most organizations, this portfolio is still assembled largely through expert judgment, making it an investment decision under uncertainty.
As with any investment, allocating resources is not enough. We also need a way to assess whether these choices are delivering economic value. That requires a structured review process that compares expected outcomes with actual results and helps us rebalance the testing portfolio over time.
A structured approach: the four-step process
To build and maintain an economically optimal testing portfolio, organizations should follow a systematic four-step process:
- Identify & quantify risks — Gather stakeholder concerns and fears, express them as explicit risk statements, and estimate their impact on engineering effort and business outcomes.
- Categorize & prioritize risks — Map risks to ISO/IEC 25010 quality characteristics and rank them by risk exposure (likelihood * impact), where impact may be financial, safety, legal, operational, or reputational.
- Decide where, how and how much to test — Select testing types, levels, techniques, coverage targets, and practices that produce credible evidence efficiently, balancing static and dynamic activities.
- Review and rebalance the portfolio — Periodically assess risk reduction versus effort, then reallocate investments to maintain economic optimality
This cycle keeps testing investment aligned with business priorities, avoids both under-testing and waste, and adapts as risks and priorities evolve. The following sections detail each step with practical guidance.